Authors: Ashok Agarwal, Ph.D. , Manesh Kumar Panner Selvam, Ph.D., Rakesh Sharma, Ph.D., Aditi Sharma, M.Sc., Sajal Gupta, M.D., Ralf Henkel, Ph.D.
Download PDF: https://mes-global.com/wp-content/uploads/2024/05/Yo-Home-Sperm-Test-Comparison-of-motile-sperm-concentration.pdf
Objective
To test the ability of the smartphone-based YO Home Sperm Test to accurately and precisely measure motile sperm concentration (MSC) versus the SQA-Vision, an automated laboratory semen analyzer.
Design
MSC compared for the YO device on Galaxy and iPhone smartphones versus the SQA-Vision in a double-blind manner.
Setting
Academic medical center.
Patient(s)
Donor semen samples from 24 men in 144 aliquots.
Intervention(s)
None.
Main Outcome Measure(s)
Accuracy, precision, and agreement assessed between the YO device and the SQA-Vision for MSC results.
Result(s)
The YO device demonstrated good correlation and good to moderate agreement with the SQA-Vision for MSC results up to a range of 94 × 106/mL with Pearson and concordance correlation coefficient above 0.92. The YO also showed a very high level of accuracy (97.8%) with positive and negative percent agreement above 94%. The difference in coefficient of variation between the YO and the SQA-Vision was low (between 9.4% and 11.2%) and not statistically significant. The precision among the YO phone devices was lower (16.0%) than the manufacturer’s claim of ≤20%.
Conclusion(s)
The smartphone-based device has a high level of accuracy and precision when compared with the SQA-Vision. It can detect samples with abnormally “low” MSC (below 6 × 10⁶/mL cutoff), which supports its use as an effective home sperm test for screening “low” and “moderate/normal” MSC cases. In addition, the device effectively identifies varying levels of normal MSC in a precise manner over a wide range of normal MSC. Thus, the YO Score can improve patient satisfaction and empowerment.
The etiology of infertility, a condition that affects 15% of couples worldwide, is shared equally between men and women (1). Male factor infertility alone contributes 30% to 50% of the infertility cases in couples (2). Semen analysis, analyzing key sperm parameters such as concentration, motility, and morphology, is the standard diagnostic tool to evaluate male factor infertility (3, 4, 5). Based on criteria established by the World Health Organization (WHO) (6), abnormality in one or more of these parameters is significantly associated with male factor infertility (7).
In clinical diagnostic laboratories, conventional semen analysis is performed using both manual microscopic and automated testing systems, including computer-assisted semen analysis or sperm analyzers such as the integrated visual optical system (IVOS) and SQA-Vision (Medical Electronics Systems) (2, 6). Inherent in each technology are the limitations that inhibit widespread point-of-care use (2, 8). Manual semen analysis involves skilled technicians and labor-intensive sample inspection using a microscope, and often the results are subjective and prone to human error. On the other hand, automated sperm analyzers, which serve as an alternative approach to manual semen analysis, require expensive equipment, which limits their widespread use (8, 9).
The process of semen analysis itself has prevented its widespread acceptance as the first diagnostic test for suspected infertility. Among couples presenting for infertility assessment, 18% to 27% of men will not be tested (10). Many men find the process of collecting a semen sample in a sterile, clinical setting to be stressful; they may not agree to deliver a sample for testing or will fail to obtain a sample under such conditions (2, 11, 12). In the absence of a clear-cut evaluation and diagnosis of the male partner, the female partner may undergo unnecessary and unsuccessful medical interventions (8, 10). This highlights the need for an at-home semen screening test that is relevant, accurate, easy to use, and affordable.
In response to the growing awareness of the challenge of male semen analysis testing, affordable at-home sperm analysis screening has been introduced to the consumer market (9). This home approach to sperm testing presents an attractive solution for men, allowing them to perform a screening test privately at their own discretion. Several home-based male fertility assays have been cleared by the U.S. Food and Drug Administration (FDA), such as SpermCheck (Princeton BioMeditech) and the Trak Male Fertility Testing System (Sandstone Diagnostics) (13, 14, 15). However, these tests report only sperm concentration, one of the three key parameters for assessing sperm quality (8, 13, 15).
The emerging use of mobile phones as testing devices has established the smartphone as a powerful platform for home diagnostic testing. Smartphones process information quickly, have adequate memory, transmit data and information, display user-friendly interfaces in the form of software applications (apps), and include high-resolution cameras as well as other functions. These unique characteristics, coupled with the secure and private nature of individual mobile phones, make the smartphone a very attractive platform for home testing (8). If the onboard camera is fitted with an external optical attachment to allow proper image magnification for semen analysis, the smartphone has great potential to provide affordable, easily accessible point-of-care fertility diagnostic assays (16, 17).
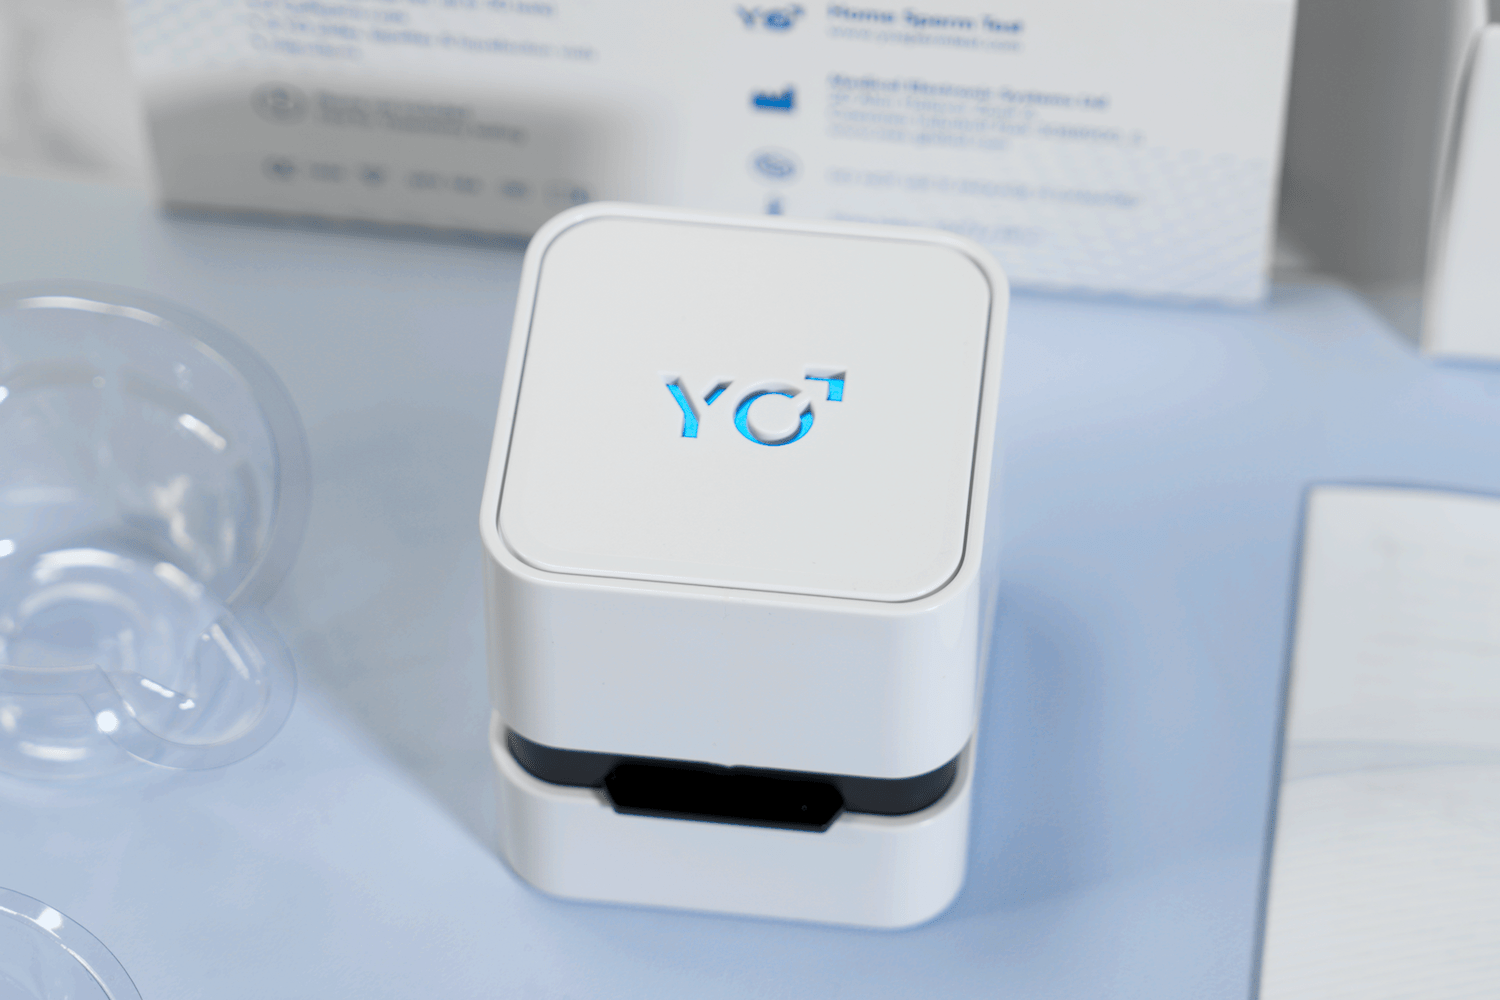
In 2017, the YO Home Sperm Test (Medical Electronics Systems) entered the consumer market as the first FDA-cleared (K161493), video-based smartphone platform for home sperm testing. The YO measures motile sperm concentration (MSC), a composite of concentration (number of cells/mL) and motility (percentage of moving sperm). It uses the smartphone’s camera and light source and the YO Clip (a mini-microscope) to capture a moving sperm video. Using the manufacturer’s proprietary algorithms, the YO app analyzes the light fluctuations caused by sperm movement in the video and translates these movements into MSC. The MSC results are dichotomized and reported to the end user as “low” or “moderate/normal” MSC based on the established 6 × 10⁶/mL cutoff, derived from the 2010 WHO guidelines (6). We evaluated the performance of the YO Home Sperm Test by comparing the MSC results obtained by this smartphone-based device with the results obtained by the SQA-Vision, an automated laboratory analyzer that accurately and directly measures MSC (18, 19).
After approval by the institutional review board at Cleveland Clinic in Cleveland, Ohio, semen samples were obtained from healthy male donors. Written consent was obtained from all the donors. A total of 24 donors were enrolled in the study, and each provided multiple semen samples after an abstinence period of 2 to 3 days. All samples were tested, irrespective of the semen quality.
After liquefaction, a total of 144 aliquots were prepared from the 24 donors; the samples were split into three equal aliquots to evaluate MSC results simultaneously on three devices in a blinded manner. The YO devices were tested with the apps for iOS (iPhone 7; Apple) and Android (Galaxy S7; Samsung) operating-system smartphones versus the SQA-Vision, an automated laboratory semen analyzer. The analysis was performed in duplicate on all devices following the manufacturer’s guidelines. Of the 144 semen samples, 55 samples demonstrated abnormal MSC values below 6 × 10⁶/mL.
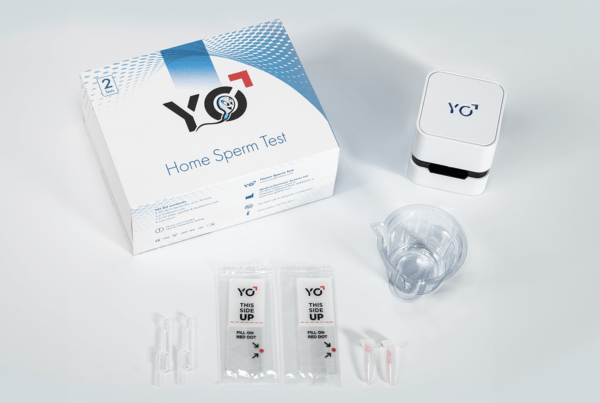
The YO Home Sperm Test kit consists of a YO Clip, fixed coverslip slide, collection cup, liquefaction powder (<5 mg α-chymotrypsin), and a fixed volume transfer pipette (Supplemental Fig. 1, available online). To begin testing, 20 μL of liquefied semen is loaded into the fixed coverslip slide, using the transfer pipette. The YO Clip is slid over the top of the smartphone and precisely aligns with the phone’s camera. The filled slide is inserted into the clip for testing. The smartphone’s autofocus automatically brings the sample into focus, and a video is captured for analysis. The YO app guides the user through all these steps using both check-off, step-by-step instructions and animations that emphasize the key processes.
During testing, the YO Clip functions as a microscope that uses the smartphone’s camera and light source to capture a 30-second sperm video. The software then analyzes the sperm video by identifying light signal and color changes in pixels to detect moving cells, translating this movement into MSC via proprietary algorithms. For study purposes, the MSC results were retrieved directly from the YO device with no further interpretation steps (i.e., dichotomizing the MSC values into low or moderate/normal results).
Smartphones and YO Application
Each test on the YO device was conducted on two types of smartphones, a Galaxy S7 and iPhone 7. The YO application was downloaded from the Google Play or the iPhone App Store and was properly installed on the relevant iOS or Android operating system. Before reporting the test results, the YO app performed internal quality control to ensure the precise alignment of the clip on the phone, proper sample loading of the slide, and correct slide insertion into the clip.
Reference Method
The YO device was compared with results from the SQA-Vision, an FDA-cleared automated laboratory semen quality analyzer that performs a direct measurement of MSC. The SQA-Vision technology, which is widely used in hospital laboratories and in vitro fertilization centers, is based on the detection of electro-optical signals combined with spectrophotometry, interpreted by proprietary algorithms. The performance of SQA-Vision technology has been discussed and validated in previous studies (18, 19).
For quality control purposes, QwikCheck Beads (Medical Electronic Systems), which include two known concentration levels of latex beads and a negative concentration/motility control solution, were tested daily on the SQA-Vision before testing the semen samples.
Semen Sample Handling
The liquefaction powder provided with the YO kit was added to the semen samples immediately after collection and was allowed to liquefy the sample for 10 minutes at room temperature. After testing, samples were reconstituted in seminal plasma to obtain various MSC levels. The semen samples were individually centrifuged at 600 × g for 15 minutes to separate the seminal plasma from the pellet. The seminal plasma was then used to reconstitute the sperm pellet to obtain varying concentrations of spermatozoa. In total 144 samples were tested in duplicate on all three devices, covering MSC up to a range of 94 × 106/mL.
Statistical Analysis
The performance of the YO Home Sperm Test on both smartphones—the Galaxy S7 and iPhone 7—was evaluated by comparing the median and 95% confidence interval for MSC results obtained by the YO device for the Galaxy and iPhone with each other and with the SQA-Vision. Normality was determined by D’Agostino-Pearson test. The data were statistically evaluated using MedCalc software (version 17.8) to calculate the precision, accuracy, agreement of the YO device and YO Score.
Precision
To evaluate the repeatability of the YO system, coefficients of variance (CV%) were calculated within each device (SQA-Vision, YO iPhone, and YO Galaxy) by comparing duplicate measurements of all 144 samples. The averaged CV% was calculated within and between the YO devices to determine each device’s precision. To avoid misinterpretation of low-end numbers, MSC values that fell below the lower detection limit of 1.5 × 10⁶/mL were excluded from the CV% calculation. The precision between the two smartphone devices was analyzed in the same manner.
Accuracy
To examine the clinical agreement between a smartphone-based test and the SQA-Vision, the positive percent agreement (PPA) and negative percent agreement (NPA) were calculated between the MSC results obtained on the YO smartphone devices and on the SQA-Vision as the comparator method. An MSC of 6 × 10⁶/mL was set as the cutoff between positive and negative results. Vertical scatterplot diagrams were created to represent the qualitative performance of the YO device to measure MSC.
Agreement of YO device and SQA-Vision
To evaluate the level of agreement of the YO device to accurately calculate the MSC compared with the SQA-Vision, a regression line including Pearson and concordance correlation coefficients was calculated. In addition, analysis of covariance (ANCOVA) was used to determine whether there were differences in the slopes of the YO devices.
YO Score (MSC ranking)
To provide further ranking, the MSC results were converted into a “YO Score,” a YO feature that categorizes MSC levels into ordinal groups. The series of YO Scores, expressed in steps of 10, were established based on the WHO distribution of values for semen parameters from fertile men whose partners had a time-to-pregnancy of 12 months or less. A polynomial relationship was generated between the corresponding WHO study centiles and the MSC values through multiplication of concentration and percentage of motility. The average MSC and standard deviation for each YO Score was calculated. In addition, analysis of variance and post hoc Scheffé analysis were performed to determine whether there were statistically significant differences between the YO Scores.
Results
The main focus of this study was to evaluate the performance of the YO device in determining the MSC above and below the 6 × 10⁶/mL cutoff level with a maximum limit of 94 × 106/mL. The MSC results of the YO devices were compared with results from the SQA-Vision in a double-blinded manner. Overall, the study demonstrated the accuracy of the YO devices (on a Galaxy S7 and iPhone 7) to correctly identify abnormal MSC values and to accurately rank normal values of MSC up to a range 94 × 106/mL.
Methods Comparison
Table 1 displays the repeatability, precision, and correlation coefficients of MSC obtained by the YO devices versus the SQA-Vision. The median and the 95% confidence interval (CI) are in close alignment, demonstrating minimal to no systematic discrepancies. The intra-device CV% was found to be lower than 11.2% and in close alignment between the YO devices and the SQA-Vision. No statistically significant differences were found between the devices when the SQA-Vision and YO devices were compared for CV%.
| Device | Motile sperm concentration (×106/mL) | Precision (CV%) | Correlation coefficient: SQA-Vision versus | |||
|---|---|---|---|---|---|---|
| Median | 95% CI | Intra-device | Inter-device | Concordance | Pearson | |
| YO iPhone 7 | 11.95 | 6.90–19.99 | 10.2 | 16.0 | 0.96 | 0.96 |
| YO Galaxy S7 | 15.08 | 6.43–27.41 | 11.2 | 0.92 | 0.97 | |
| SQA-Vision | 15.58 | 8.05–22.54 | 9.4 | NA | 1 | 1 |
The inter-phone (iPhone vs. Galaxy) precision was slightly higher and found to be less than 16.0%. The comparison of MSC results obtained using the automated sperm analyzer to those obtained by both smartphone devices resulted in highly statistically significant (P<.001) regression lines, with Pearson and concordance correlation coefficients above 0.92 (Fig. 1A and B ; see Table 1). Both YO devices showed a positive slope in the regression, with a higher slope for the YO Galaxy compared with the YO iPhone. The statistical significance tests refer to analyses of covariance (ANCOVA) showed that the slopes were statistically different (P<.0001).

Clinical Performance
| Device | N | PPA | NPA | FP cases | Accuracy |
|---|---|---|---|---|---|
| YO iPhone 7 | 144 | 100.0% | 96.6% | 3 | 98.3% |
| YO Galaxy S7 | 144 | 100.0% | 94.4% | 5 | 97.2% |
| Overall | 288 | 100.0% | 95.5% | 8 | 97.8% |

YO Score
Discussion
Conclusion
Acknowledgments
Supplementary data